Analytics for Testing
By:
Rebekah Beran
on 5/24/2019
Do you remember how old you were when the first personal computer came out over 35 years ago, or the first cell phone over 45 years ago? If you are younger than those numbers, maybe you remember when the internet became a big hit about 30 years ago, or when Facebook first launched just under 15 years ago.
These technologies, though relatively young in their years, have come a long way since their debut. New phones, tablets, computers, devices and social media venues are constantly developing and the days of only having a few options to choose from are far over. This means a wide variety of platforms are being used to access content around the world.
Having Google Analytics can give you a detailed peek into the usage of these platforms, providing valuable insights of your audience. As technology trends advance and generations grow, your analytics with fluctuate with it. While Internet Explorer was a popular browser many years ago, it is seldom used now that Microsoft has moved to the newer Edge browser, and has stopped supporting IE.
Take a Look
Breaking down the different platforms that are accessing your website will help you get to know your audience to aid in providing the best user experience possible. There is a vast amount of data available within Analytics, but as far as testing your site cross-platform, you’ll only need to look at a couple areas. You can start with an overall look or drill down to what browser is being used the most, what operating system it is on, and what screen size or device it’s being viewed from.
Note – If you have recently launched your site and added the analytics tracking, you will need to give it time to start collecting user data.
Determine Top Priorities
If the majority of your audience is using their mobile phone to view your website, you want to make sure everything looks good and is working properly from the mobile platform. If it is the opposite case, and everyone is viewing from a laptop or desktop computer, then it might not be as vital to put a lengthy amount of time into developing a great mobile experience… just yet.
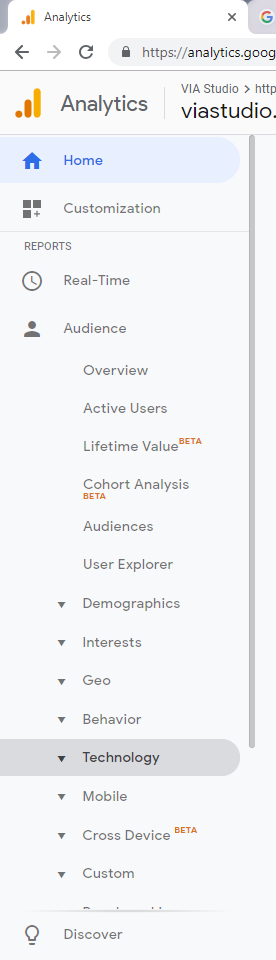
In the analytics profile, you will find this information within the Reports menu under Audience. Starting with Technology, simply click Browser & OS. By default it will show the Browser data first, but you can flip between Operating System, Screen Resolution, Screen Colors, Flash Version, and even Java Support.
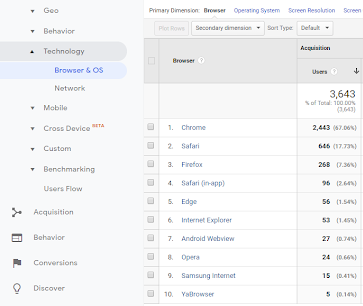
The Users data under the Acquisition columns, sorted highest to lowest, will display the number or users per data point as well as the overall percentage of the total session on the site. Typically, for Browser and Operating System at least, the top 2-4 data points will make up the majority of your user base. You could consider these as the top priorities as that is the bulk of your audience.
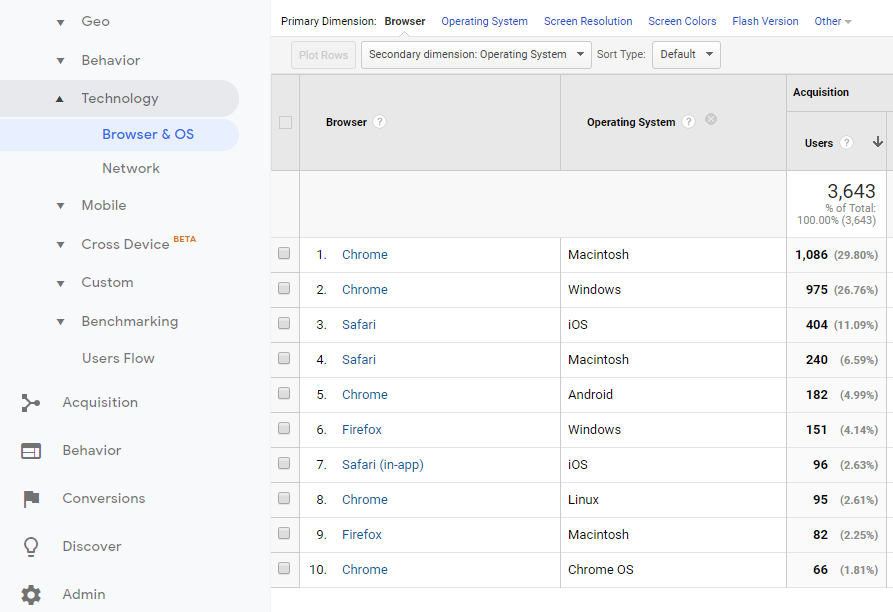
You can get more detailed by adding a secondary dimension, to really nail down the specifics of your audience. For example, viewing which browsers are being used on which operating systems or which version of the operating system is being used per browser.
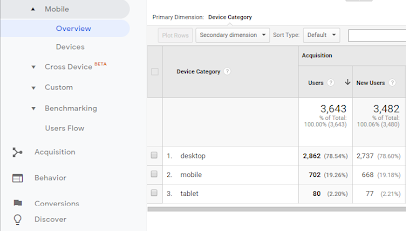
To get a clearer look of the desktop versus device breakdown, select the Mobile option below Technology. Viewing the Overview will show you the breakdown of users between mobile, tablet and desktop, while viewing the Devices option will show which devices are being used the most.
Keep Track
Your website isn’t always short-term. Yes, some of your content may be more time sensitive, but your website in general is a living, breathing thing (so to speak) that will be around for awhile. Tracking the numbers, in some form or fashion that works for you, overtime could give you a historical reference point to estimate a forecast for future usage. If you notice your mobile users are steadily growing over the past few months, it’s time to review the mobile platforms in more detail.
Consider Everyone
After looking over the analytics and the details of the majority of your audience, take a moment to consider those that aren’t represented as much in the analytics. Since they could be part of a group that will gain popularity down the road, so being proactive about their experience can help in the long run.
Compare your analytics to data collected from worldwide users on Statcounter. Their stats are based on aggregate data collected on a sample exceeding 10 billion pageviews per month, from across the StatCounter network of more than 2 million websites. Check out http://gs.statcounter.com/ to see what usage around the world looks like, some of the number may surprise you!
Related Posts

Website Accessibility: An ongoing series (Part 1 of 4)
By:Ben Wilson on 12/14/2017
Accessibility for the web (or any digital content) is a complex topic for content creators, marketers and anyone with something to say online. There are a handful of accepted standards and practices, but nothing official.
Read More »
Website Accessibility: Assessing your Accessibility (Part 2 of 4)
By: Rebekah Beran on 12/28/2017
Part 1: What is Accessibility? Why should I care? Part 2: Assessing Your Accessibility (What to Fix) ⬠YOU ARE HERE Part 3: How to Fix It? Part 4: Testing So you’ve heard talks about “Web Accessibility” lately – and maybe you have already read our part 1 to Website Accessibility to learn more about it – so the lingering question is, how do you know if your site is accessible? You could do a Google search and read through the all of the information from W3C or Section 508, but let me save you some of that time! This post will rundown which areas to examine, what to look for, and how to tell if improvements are needed. We’ll group these into two parts, each with their own sections and questions to ask yourself.
Read More »